Kalshi Concept Film Data Visualization Motion Graphics for a Prediction Market
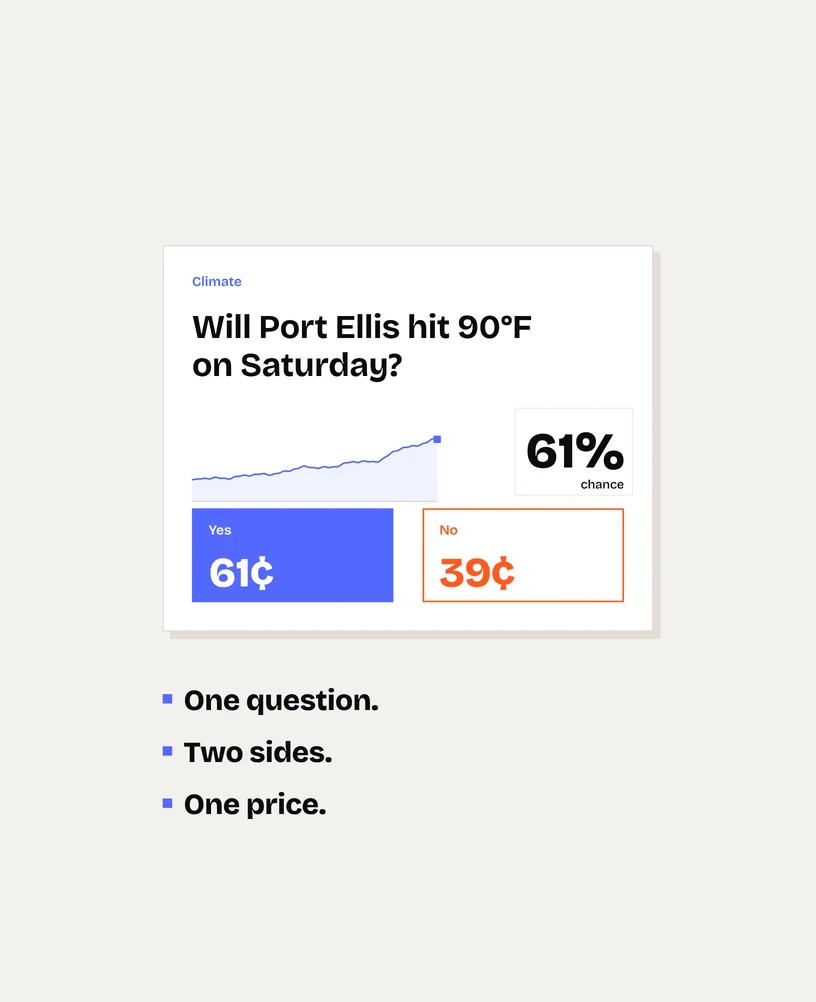
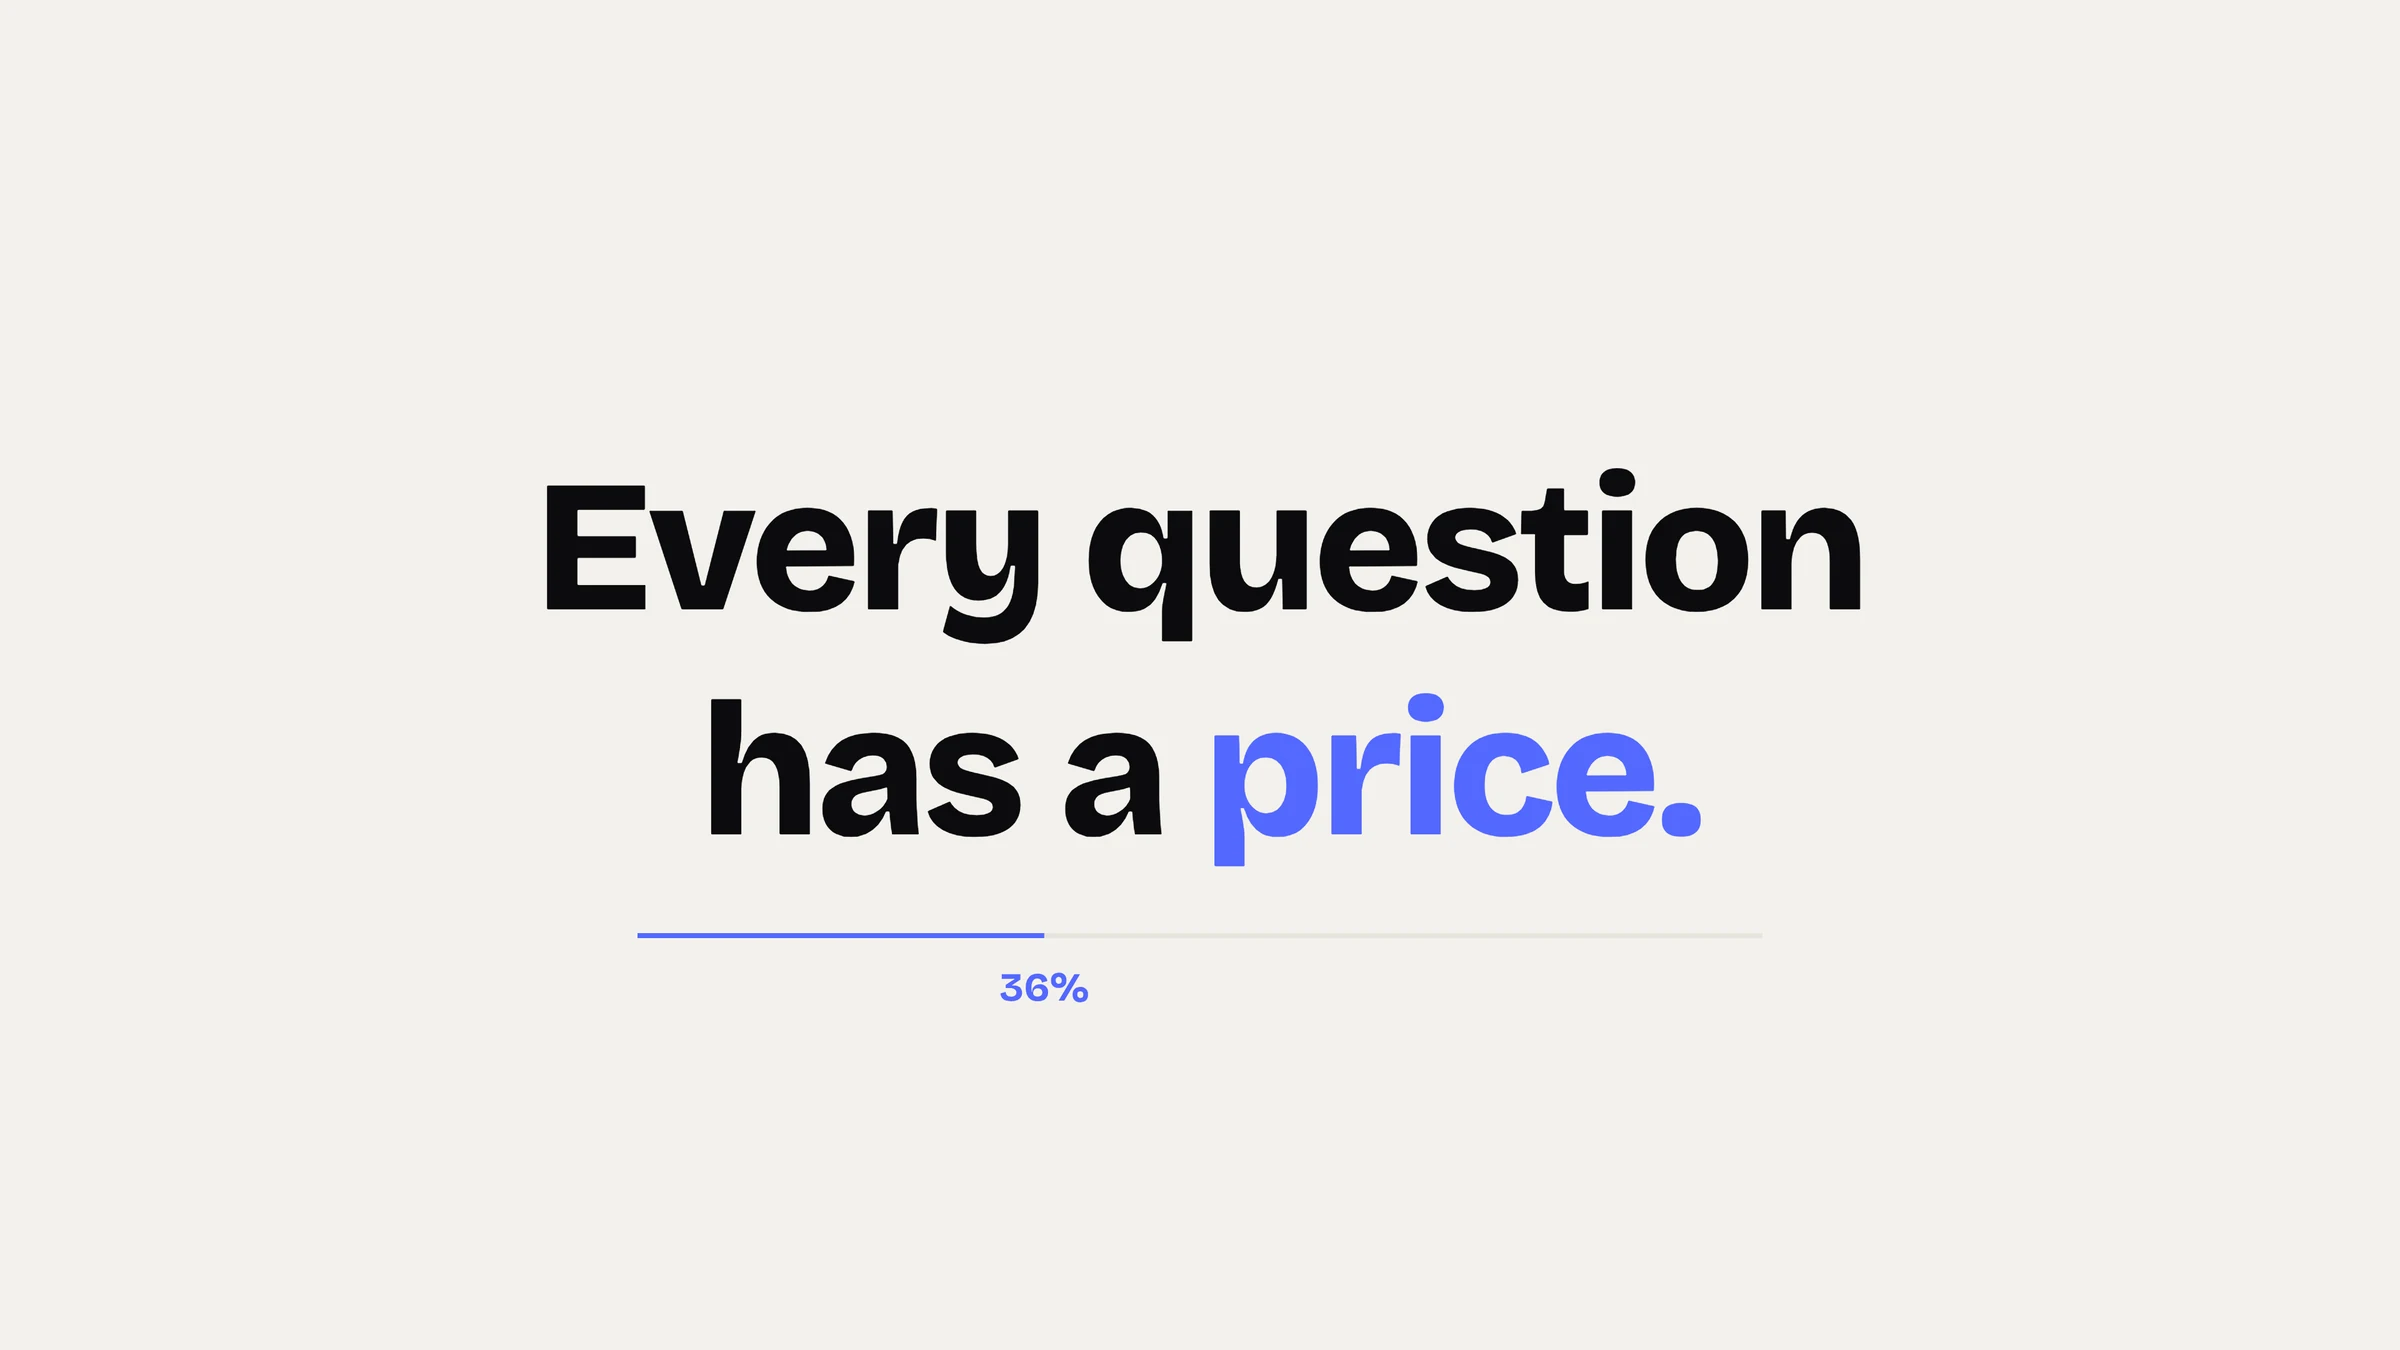
A concept film for Kalshi, a U.S. exchange for trading on real-world events: 78 seconds of motion graphics that turn a question into a price, a price into a probability and a live chart into an outcome, delivered as a 4K master at 60 fps and a vertical cut.
Client & Market Context
A Concept Film for a Prediction Market
Kalshi, a U.S. exchange where people trade on the outcome of real-world events, is the subject of this concept film: a way to show founders and marketing teams of fintech and trading companies how we turn a financial product into a story told with data.
Explaining Price as Probability
Good data visualization motion graphics start from one number. Here the number is a price that is also a forecast, and the product has no physical form to film. The film had to make four ideas clear in under a minute.
- What is a market on a yes-or-no question?
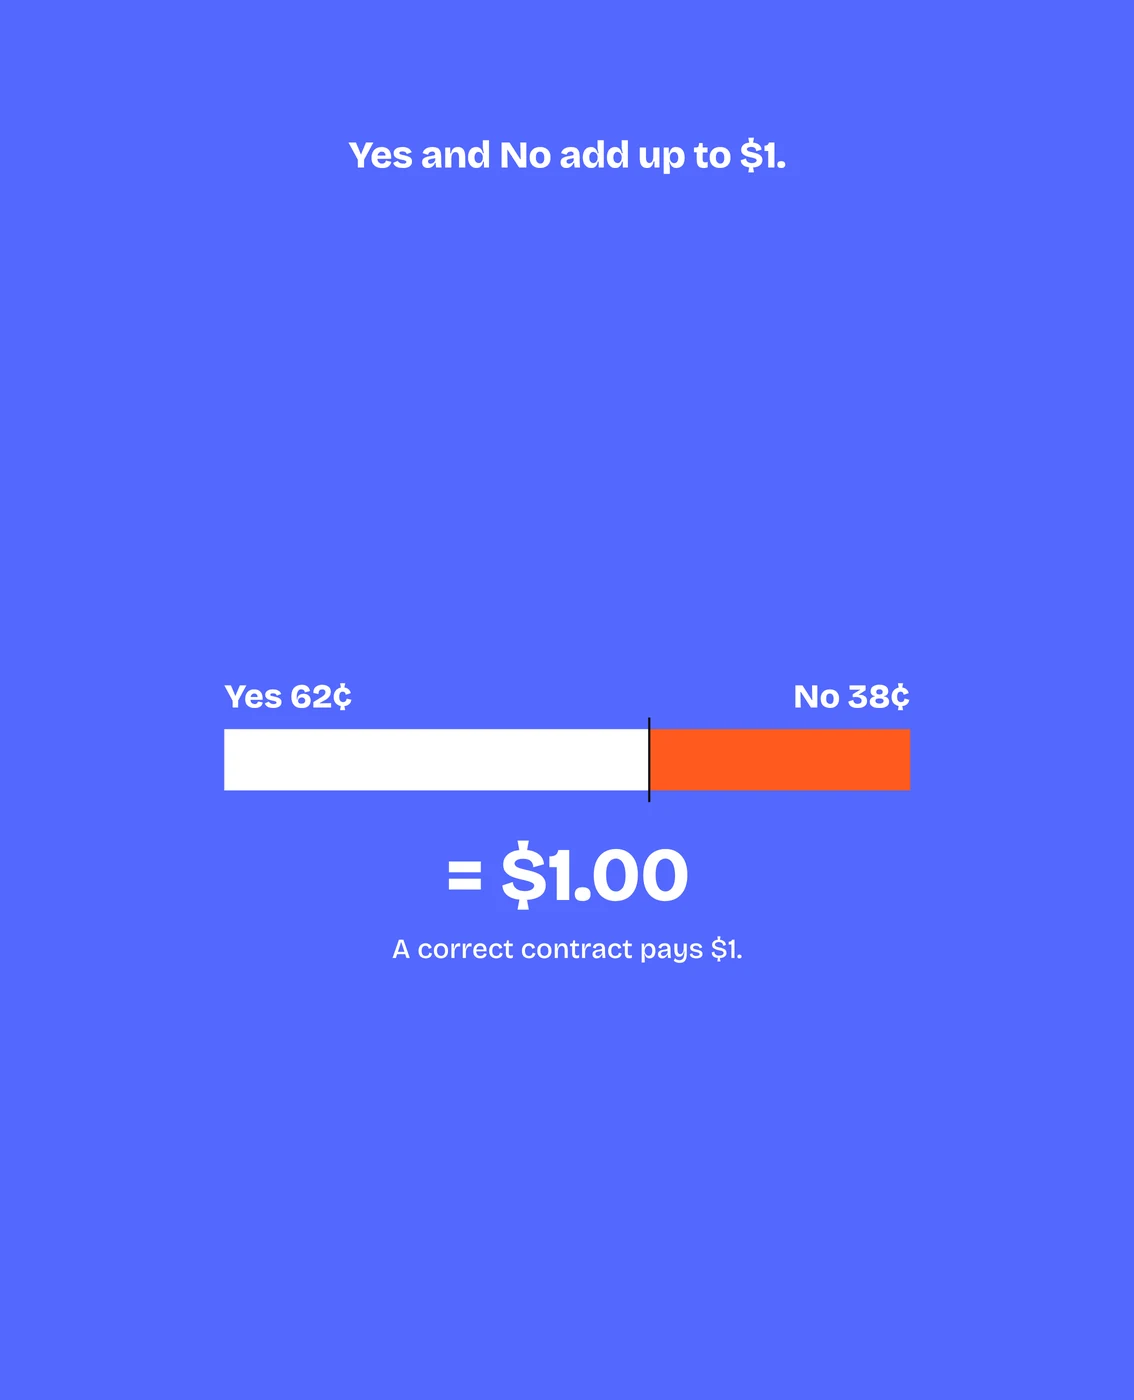
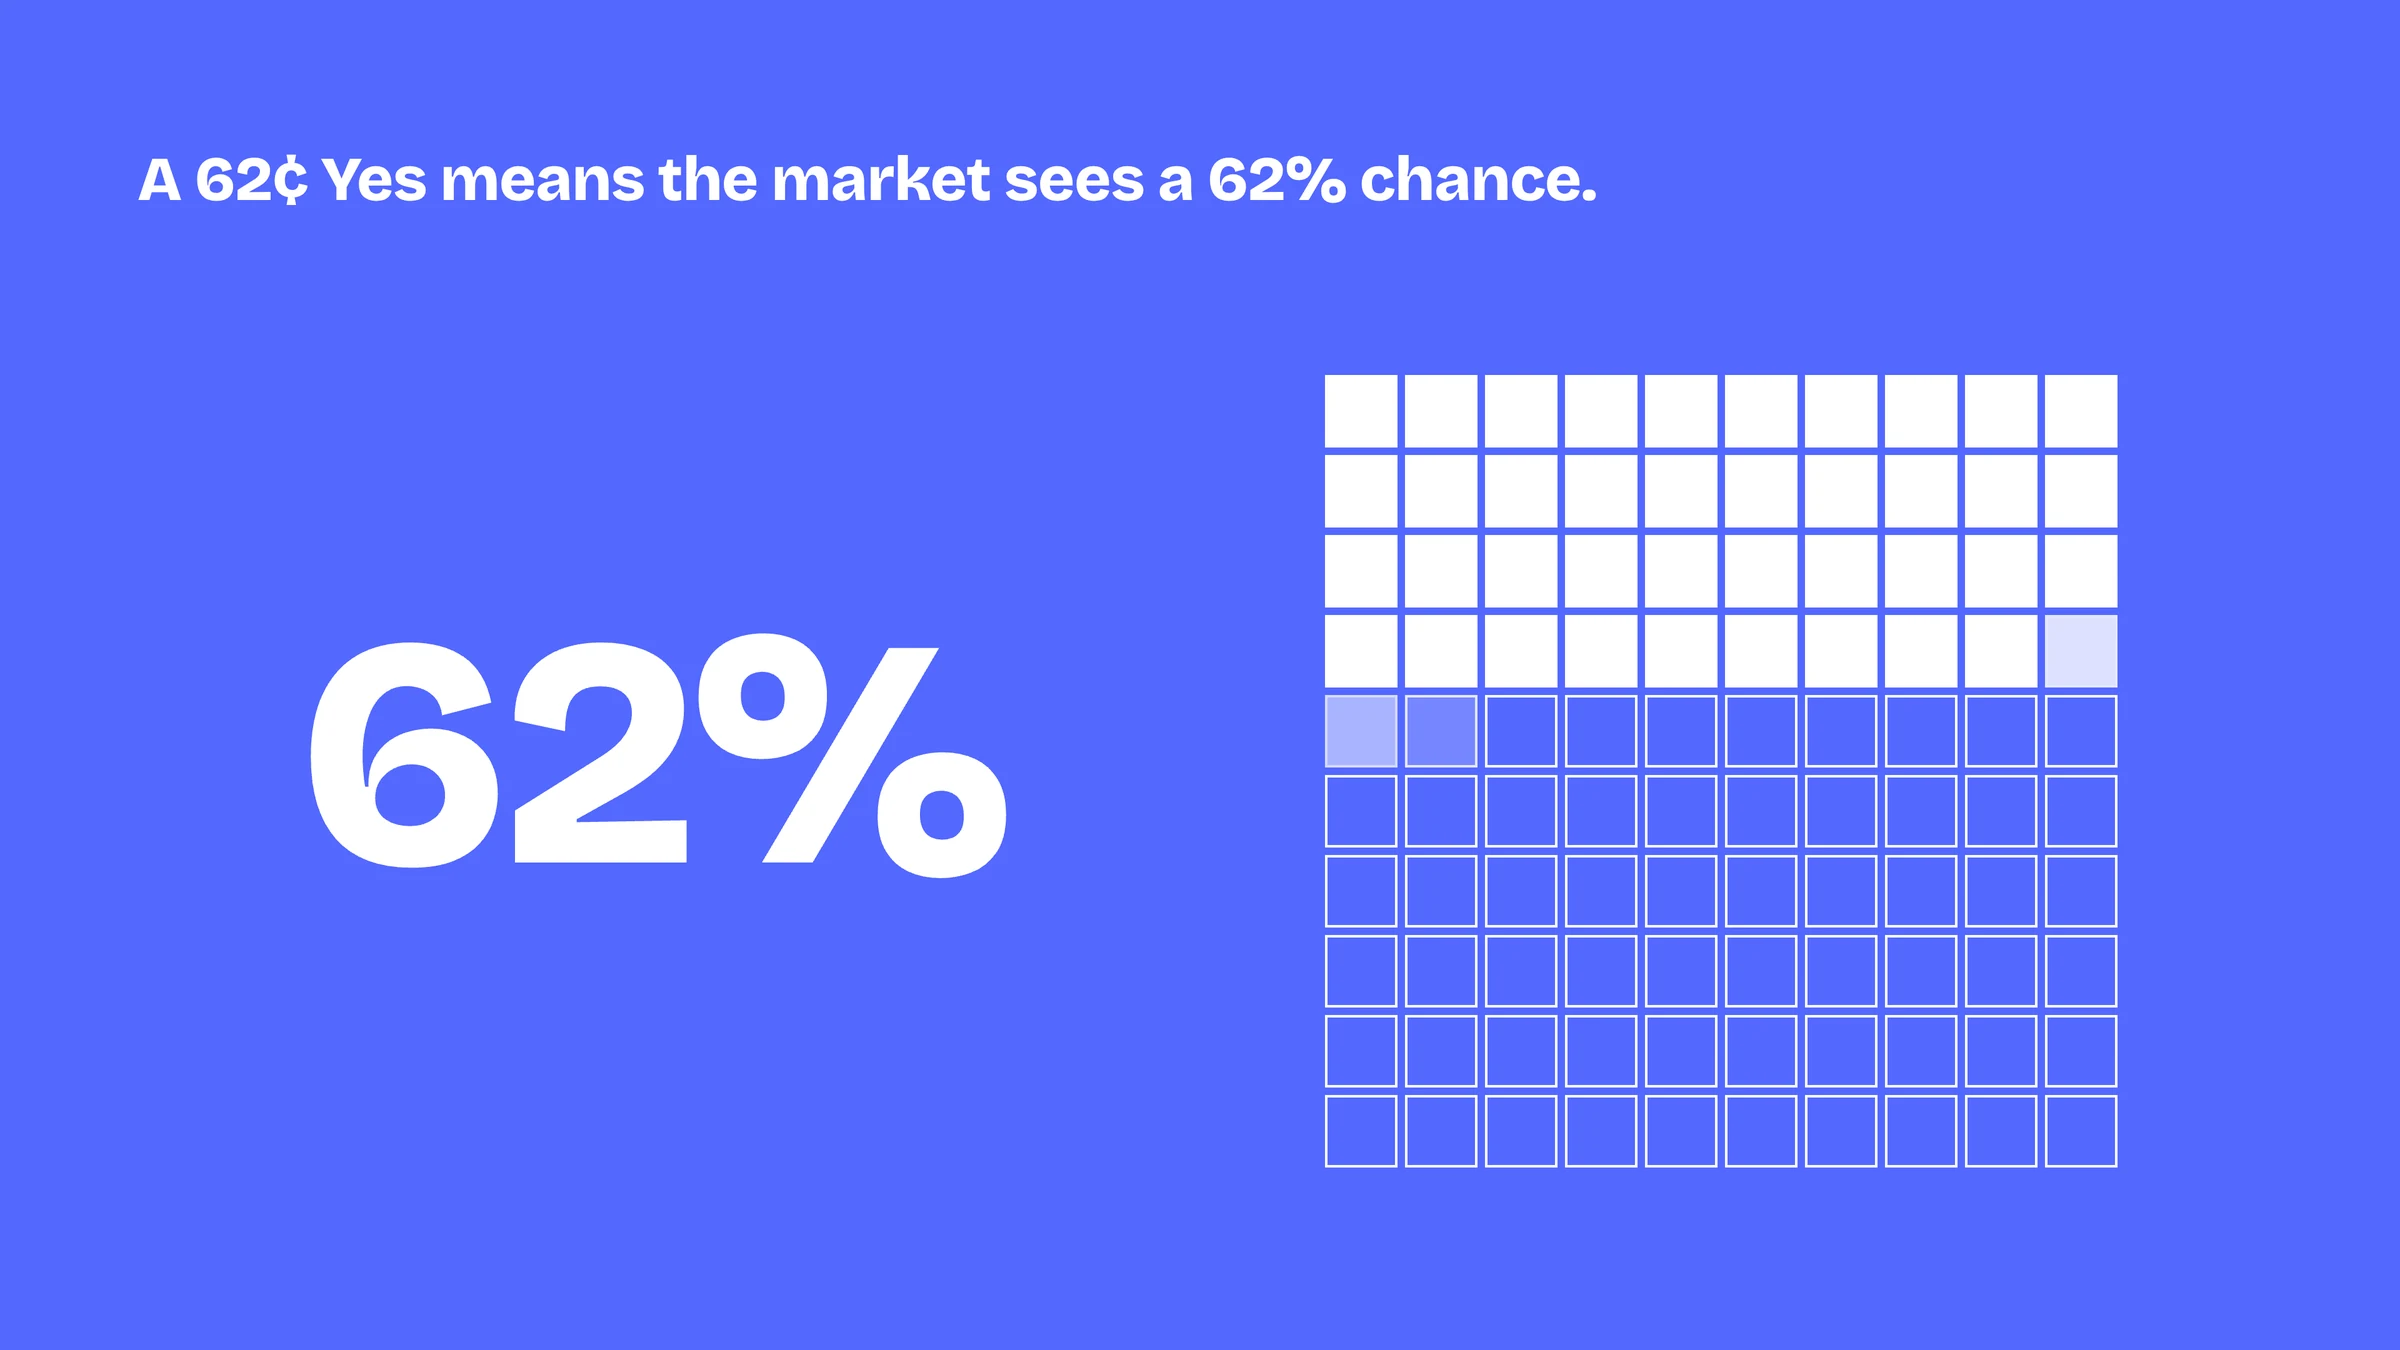
- Why does a price of 62 cents read as a 62 percent chance?
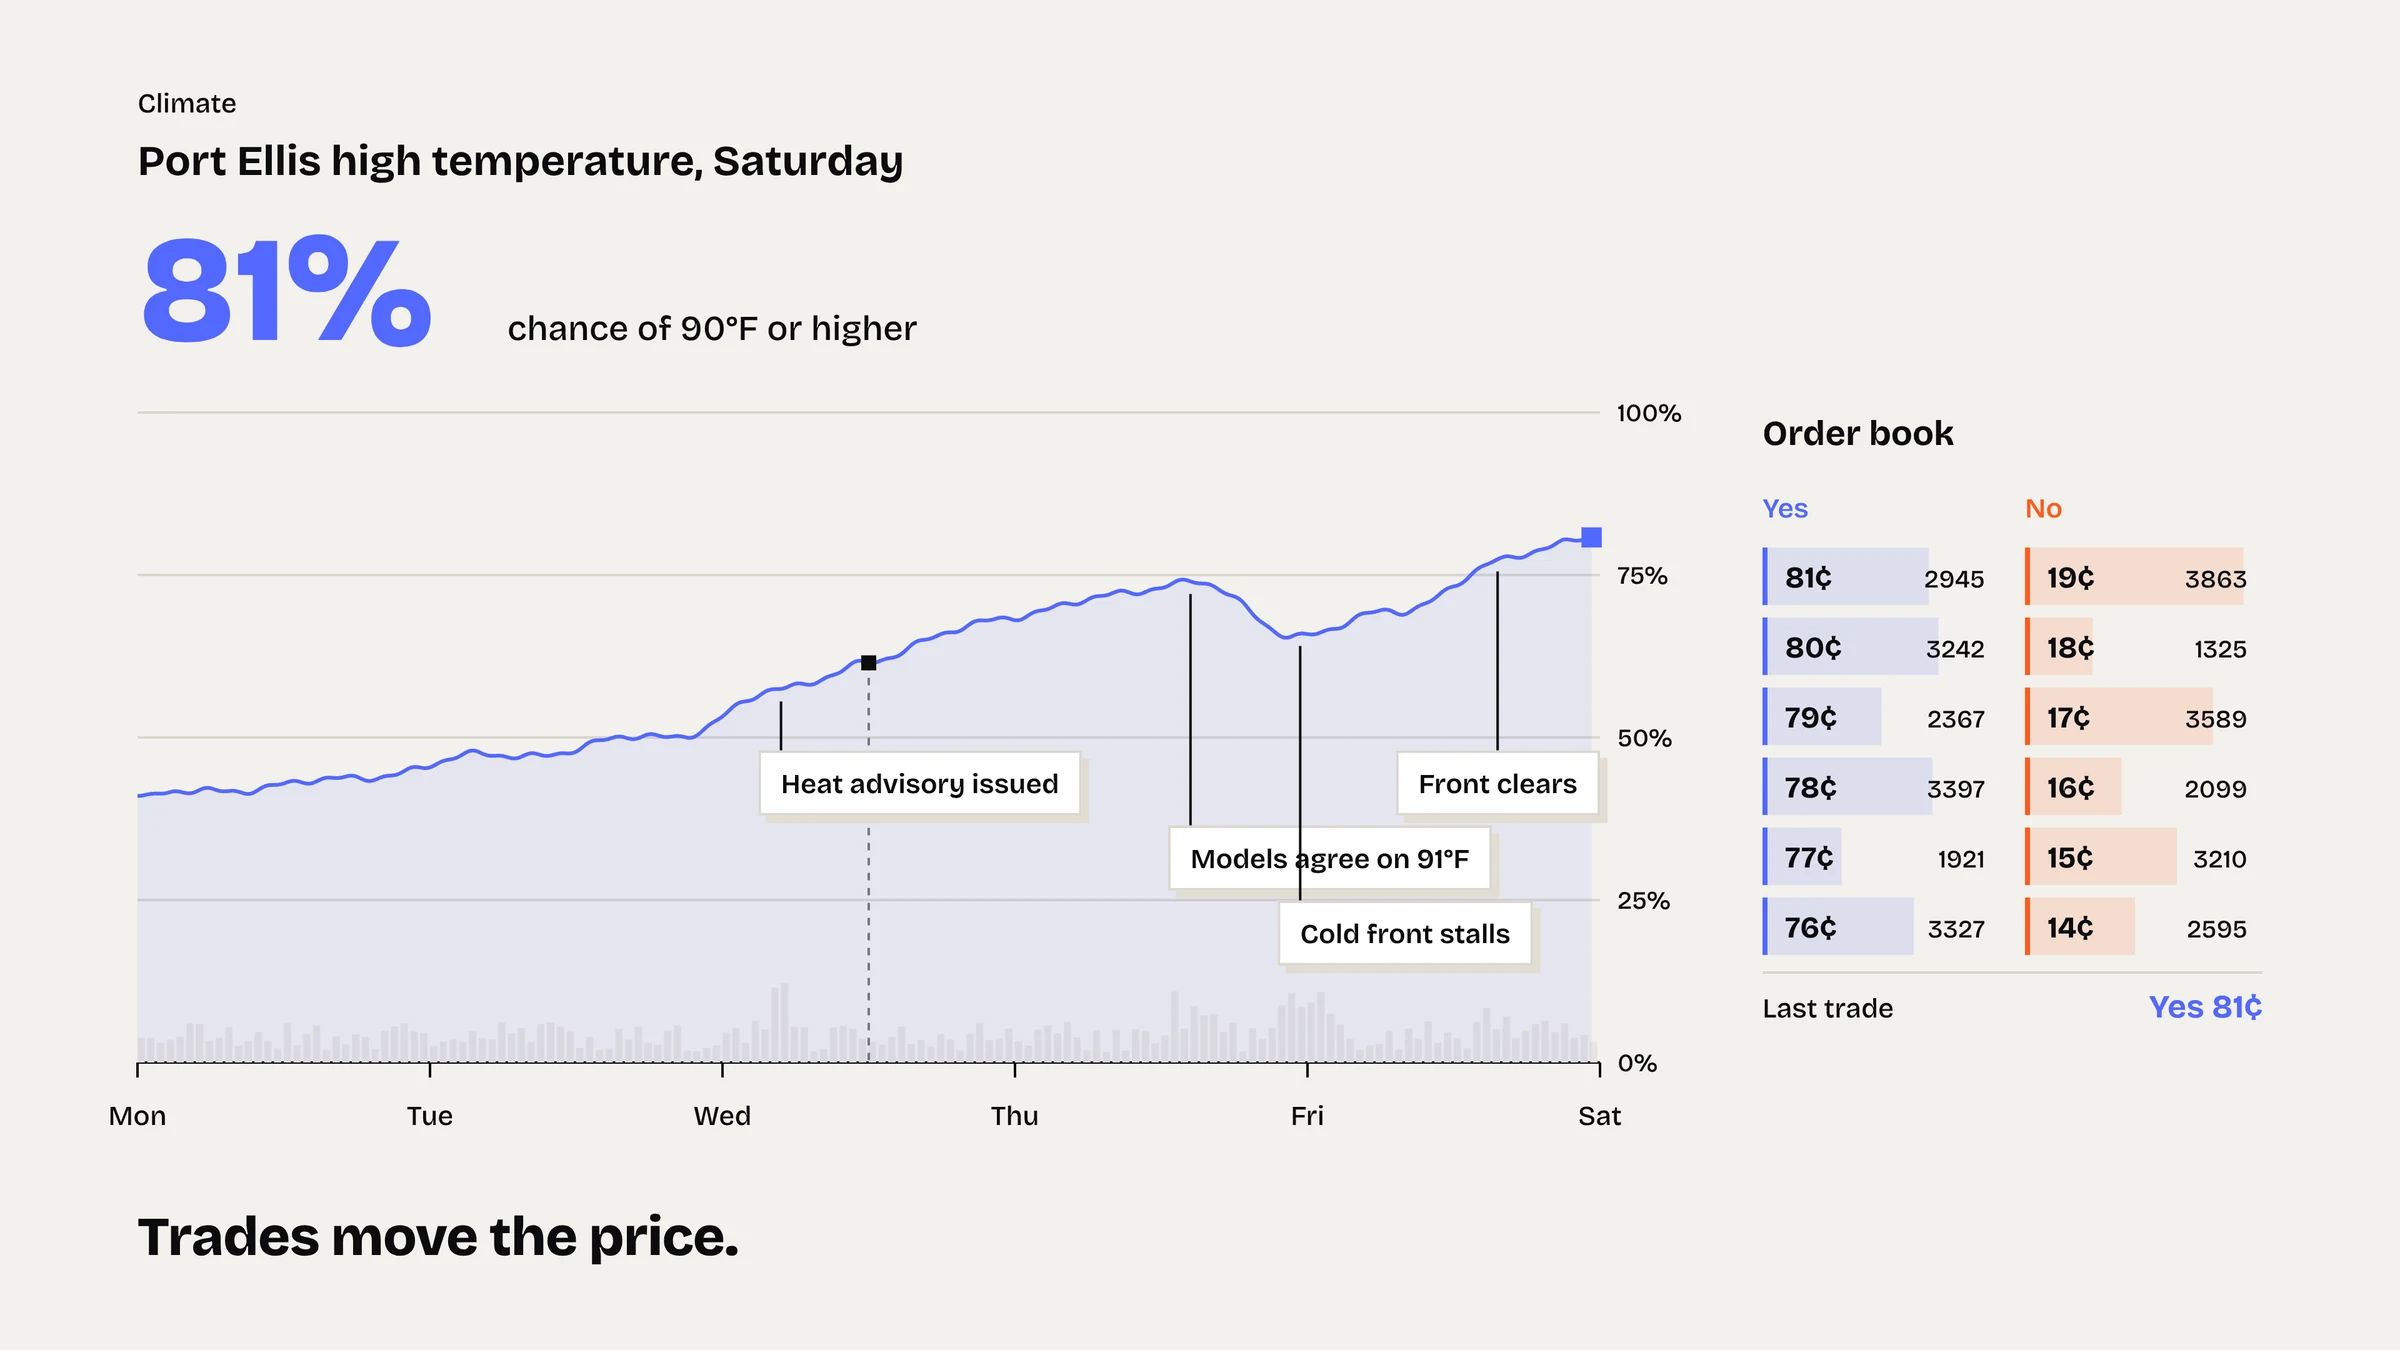
- How does that chance move before the event?
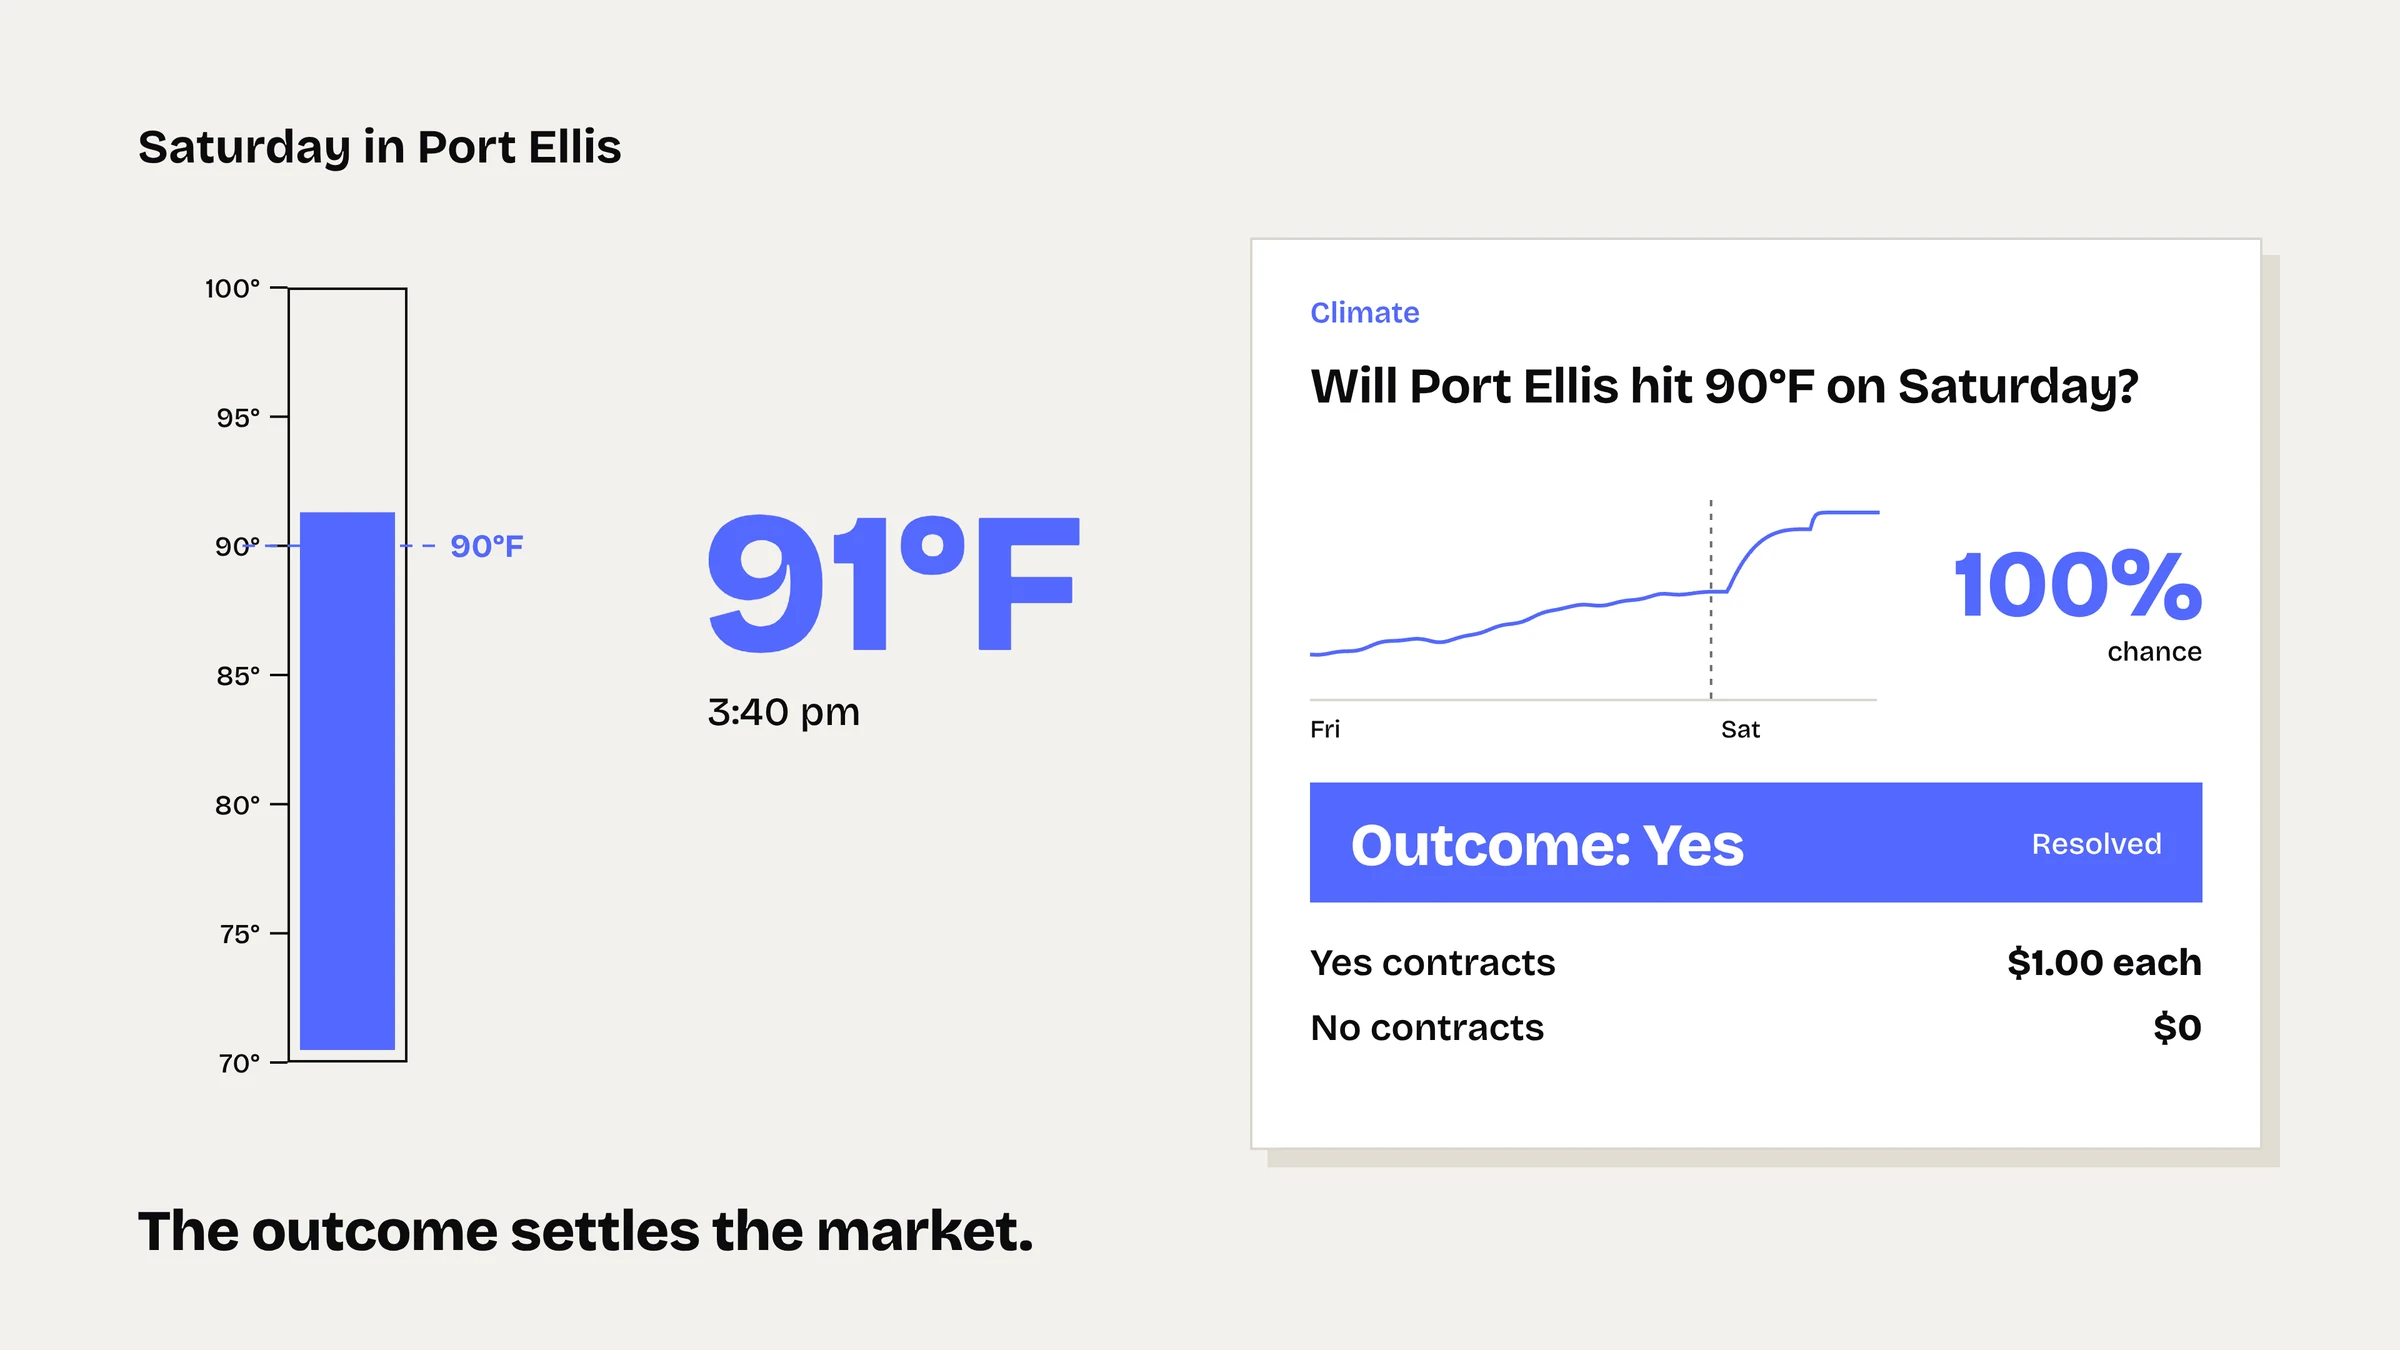
- What happens when the event resolves?
Visual Results
From a Question to an Outcome, Frame by Frame
The last stills follow the end of the film: a thermometer crossing 90°F as the demo market resolves Yes, and the closing frame with the Kalshi name, the CFTC oversight line and the risk line.
Free guide: a 60-second explainer in 12 shots, and the 4 you can cut
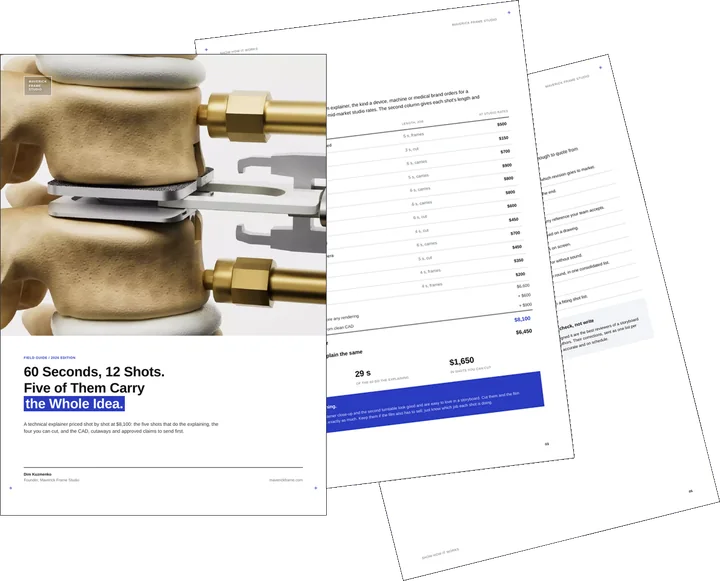
You have just seen a machine, a device or a procedure shown rather than described. Doing the same in motion is a matter of planning shots, not polishing renders. Our composite 60-second explainer, priced shot by shot at $8,100, does all its explaining in five shots. The guide gives you the priced shot list, the input to send from engineering or medical teams and the short brief for product animation.
- Free
- Instant download
- No sales call
If it didn't open, download it here.
Download the PDFRemote studio, your time zone
Planning a similar project?
Book a 30-minute call. Tell us about the project, and we will tell you which views it needs, how long it takes and what it costs.
Estimate on the call
A price range on the call, not a follow-up questionnaire.
Any stage of the project
From concept sketches to a finished model: we start from what you have.
Book a 30-minute call
Which day suits you?
What time?
Where should we send the invite?
- 30 minutes
- Free, no obligation
- Invite by email
Results & Business Impact
- 78s
concept film, from the first question to the closing risk line
- 8scenes
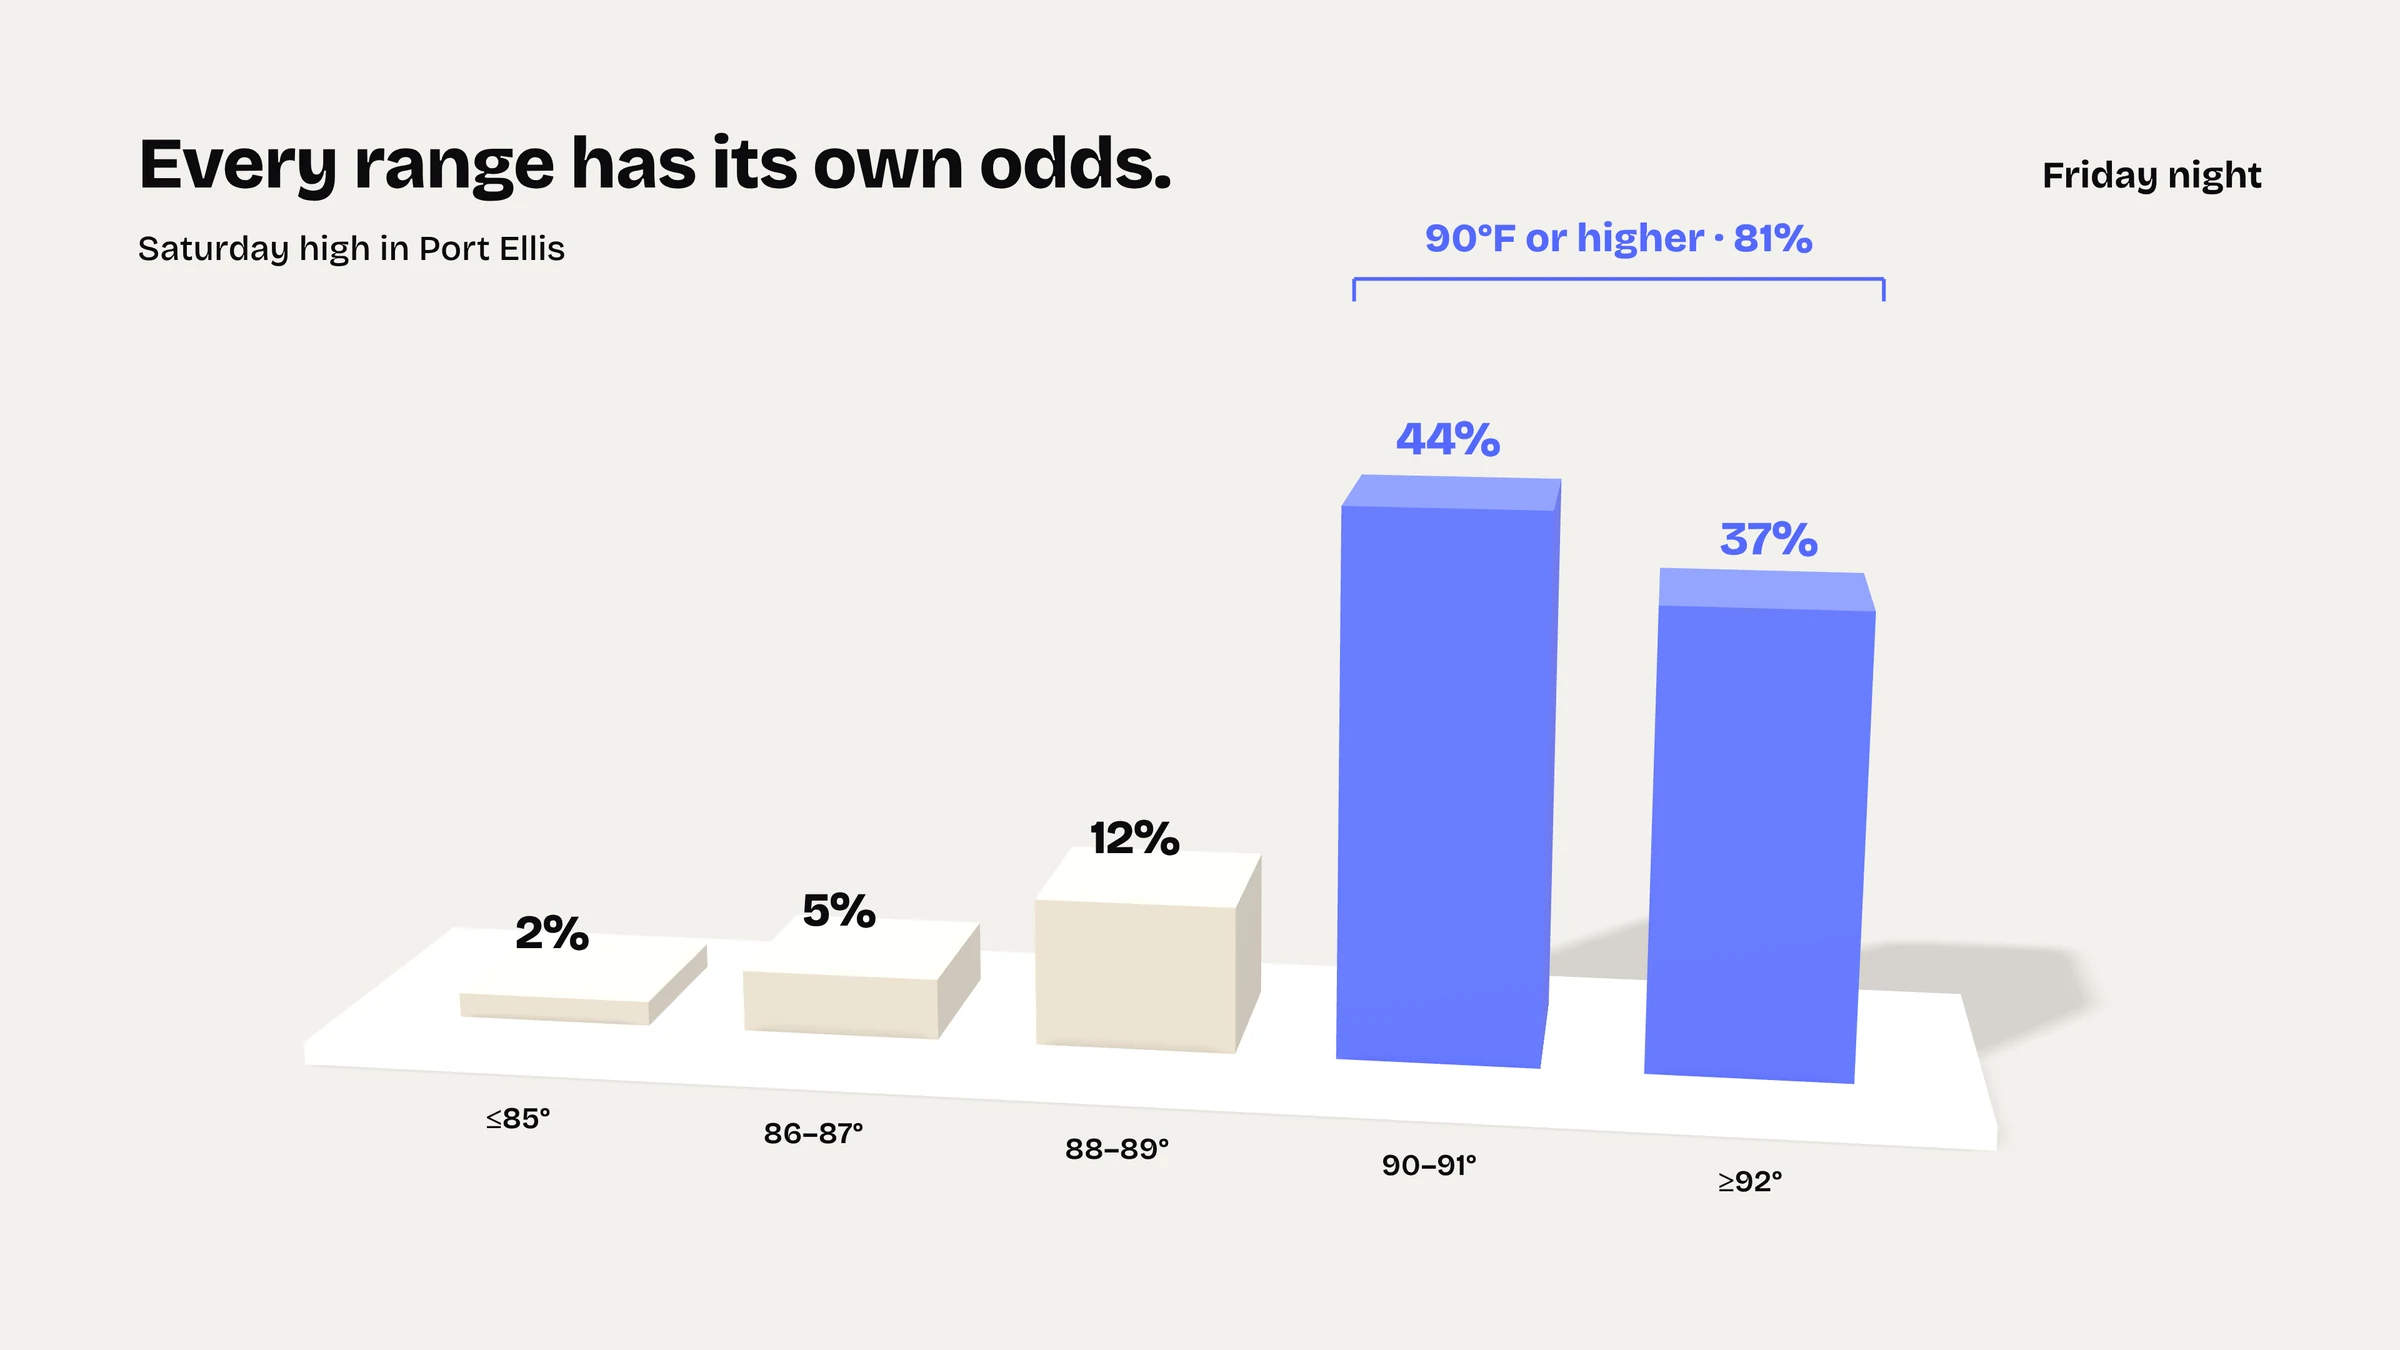
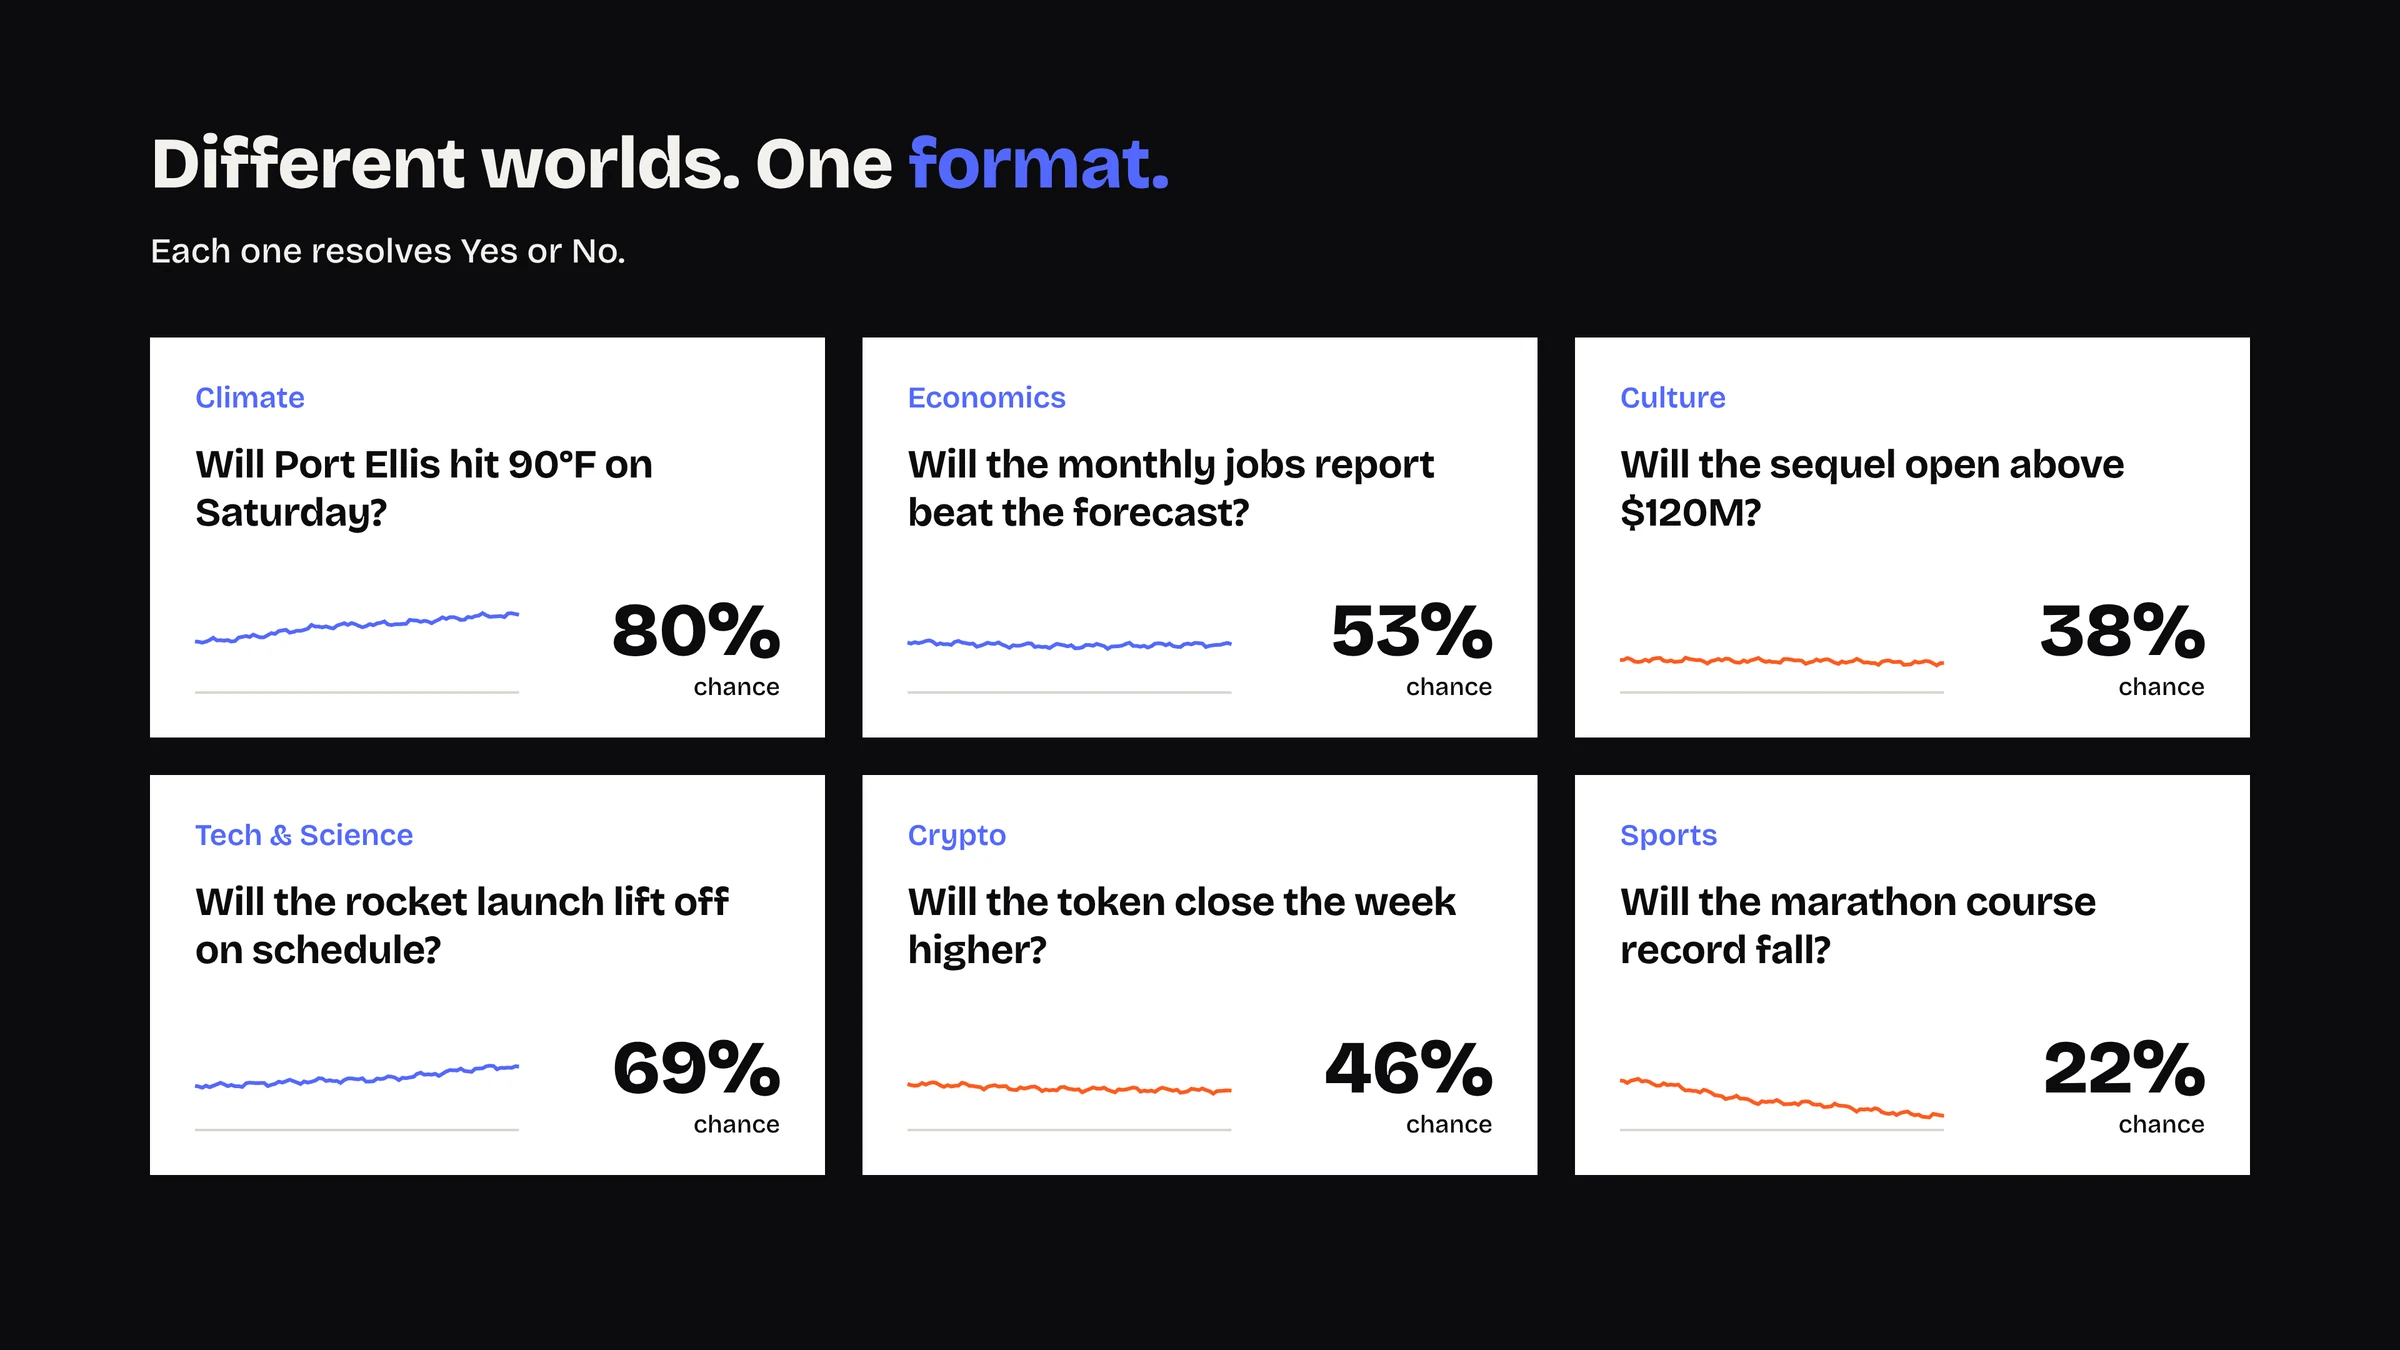
question, price, chart, ranges, markets and outcome, each cut on the beat
- 2formats
16:9 and 9:16 masters, each with its own layout instead of a crop
- 1soundtrack
music and sound effects composed for this film, with no licensed tracks
Financial products are hard to explain because the product is a number. A film that shows where the number comes from, how it moves and how it settles makes a trading product clear to a new user before they open the app.
FAQ
FAQ About This Prediction Market Concept Film
Didn’t find your question?
Ask it here. A producer replies within one business day — with an answer, not a sales call.
What is a prediction market explainer video?
Why make a concept film for a brand?
How do you keep a fintech video accurate?
How was this concept film made?
Can one project deliver both a wide and a vertical film?
Do you make videos for fintech, trading and crypto companies?
Explore Similar Animation Cases
Chainlink Concept Film Motion Graphics for a Blockchain Platform
Infrastructure with no product shot needs a world built for it, as in the concept launch film for the Chainlink oracle platform, where oracle data and transfers between blockchains become 3D scenes.
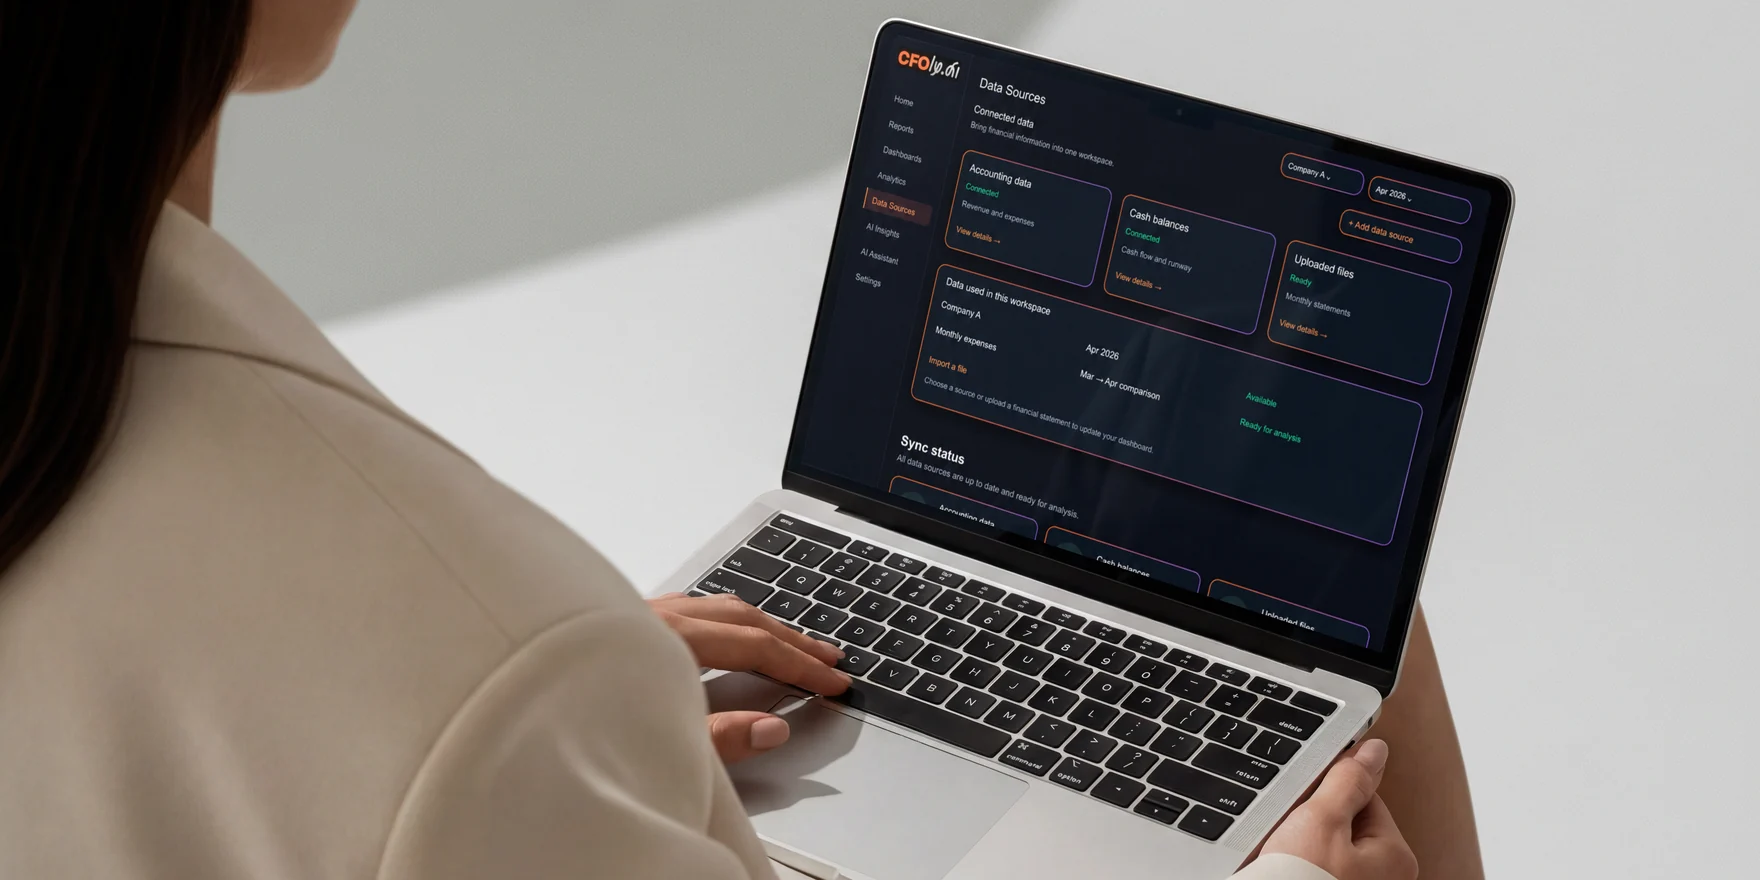
AI CFO Platform Launch Film Motion Graphics and Device Renders for a Fintech Startup
Financial dashboards read best when they move, and the launch film and device renders for an AI CFO platform turns revenue, runway and cash flow into scenes on a laptop and a phone.
Fin Concept Film A Launch Film for an AI Support Agent
A product that lives in a chat window can still carry a film, as the concept launch film for an AI support agent shows with an interface rebuilt scene by scene.